
In this blog post, we explore the impacts of the ongoing Coronavirus (COVID-19) outbreak on office utilization rates and in-person interaction levels.
Based on sensor and person-count data in offices ranging from startup workplaces to global corporations (and comprising more than 30,000,000 unique readings), we show that COVID-19 resulted in substantial drops in office utilization the week of March 7th. This was before widespread social distancing and work from home mandates were employed globally.
Moreover, even when restricting our attention to the workers who were still physically present last week, we found that in-person interaction rates fell. This means that workers were more likely to work alone when they were in the office last week rather than in physically shared settings. In other words, they were practicing social distancing in the workplace before they were mandated to employ social distancing in working from home this week.
We contextualize our results with respect to office space-type, showing that interactive spaces like conference rooms were worst-hit by attendance drops the last week.
At a Glance: Attendance Drops Intensified Last Week
Office attendance exhibits a cyclical trend based on the day of the week. The figure below shows 2 such cycles, which are the weeks of Sunday 2/23 and Sunday 3/1.
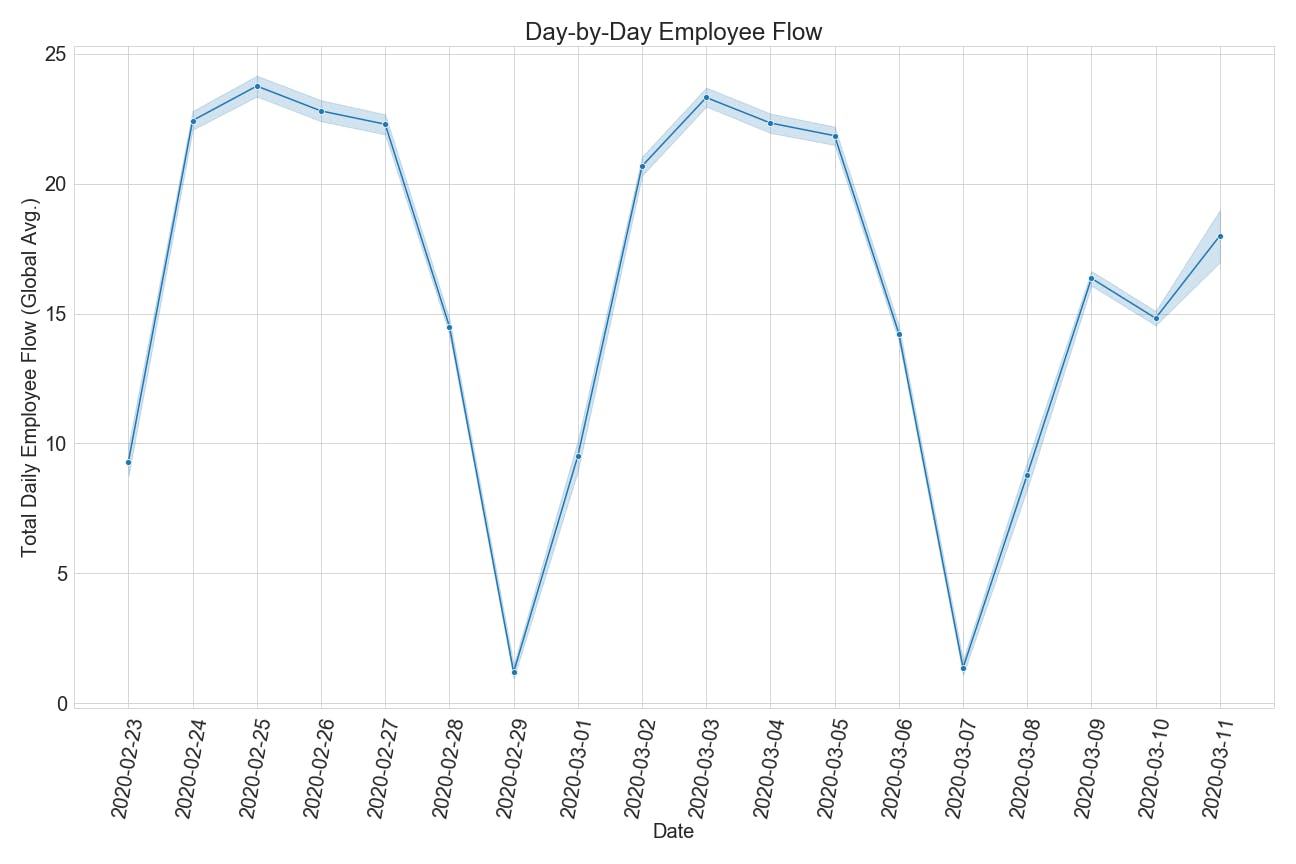
To measure both the drop in attendance and reduced hourly occupancy of offices, we use a measure called employee flow, which counts the total number of occupancy events for a workspace throughout the working day. A typical 10-hour workday has 60 such events (one every 10 minutes).
The main takeaway is that the last week (beginning on 3/7) shows a substantial drop in employee flow. However, the uptick on Wednesday 3/11 shows that the situation was still evolving and that some companies may have been practicing work from home setups at the start of the week.
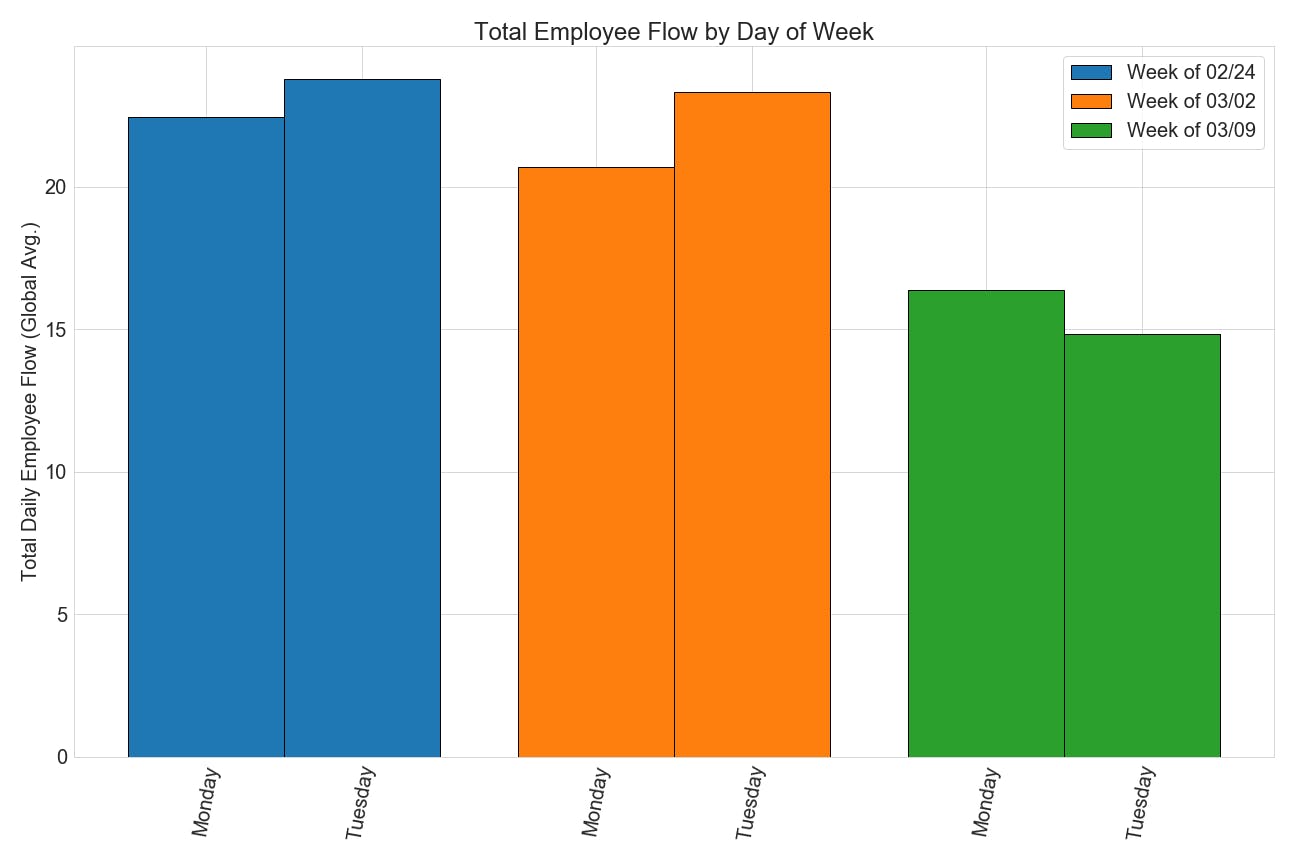
To account for the daily attendance cycle, we can compare employee flows by day of the week. As the figure below shows, while the weeks of 2/24 and 3/2 had almost identical in-office attendance (although there is a slight drop), last week shows a massive decrease in average flows.
For example, from Monday two weeks ago (3/2) to Monday of last week (3/9), we saw employee flow drop from 20.7 to 16.4. Compared to a baseline employee flow historically of 22.51, we notice that there was a minor effect from COVID-19 a few weeks ago, but last week showed the biggest drop.
In-Person Interactivity
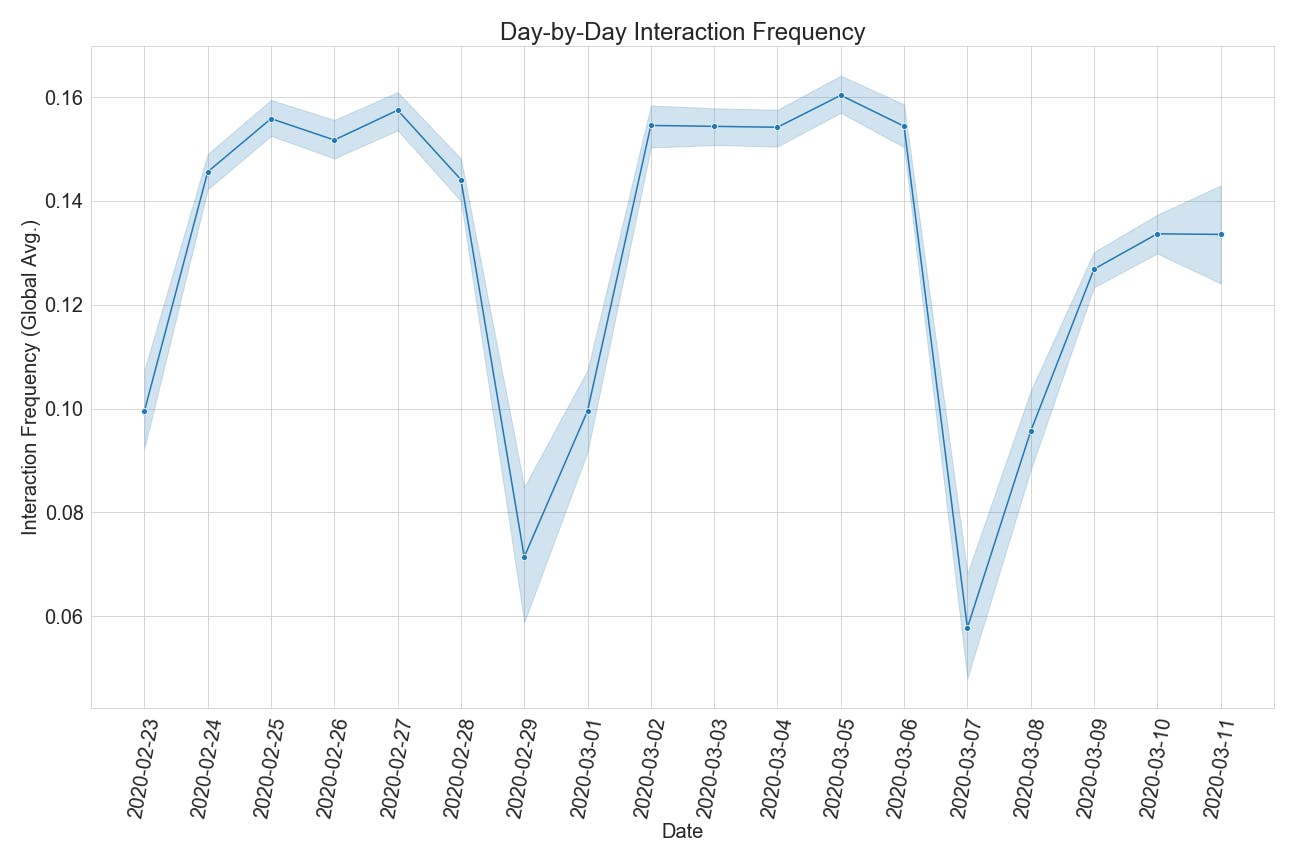
Did fears about COVID-19 affect workplace behavior last week among those who were still physically present? A simple gauge is to ask how often employees physically interact - that is, how often they occupied the same space. To measure this, we define a metric called interaction frequency.
This measures what fraction of occupancy events are multi-person occupancies. Suppose a conference room is occupied 5 times during a workday, and 2 of those occupancies involve multiple people. We would say that the conference room has an interaction frequency of 0.4 (on a [0, 1] scale).
It turns out that interaction frequency saw a big drop last week as well. Notice that this measure does not depend on the total number of employees in the office. It simply asks: of the employees present, how often are they physically interacting?
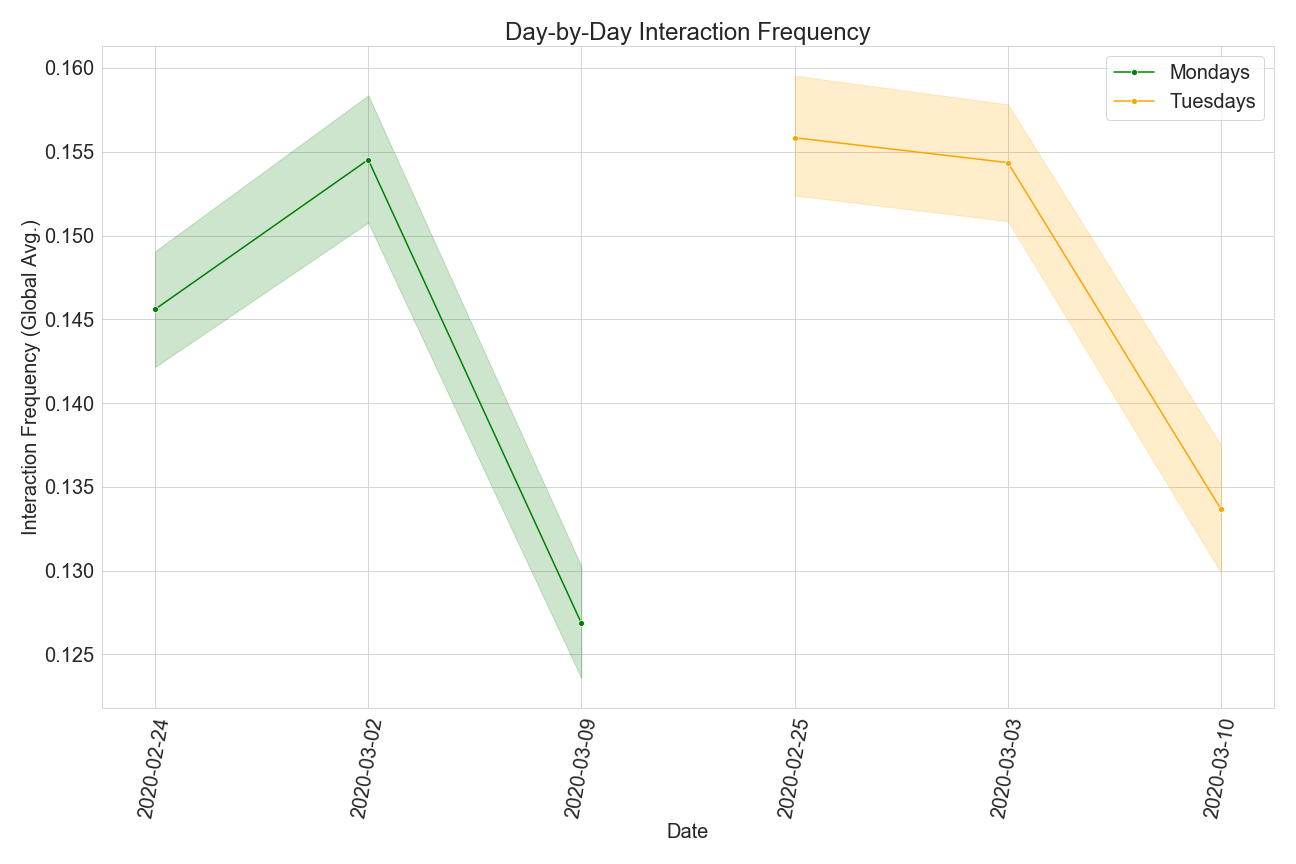
Again, we can separate out the interaction frequencies by day of the week to account for cyclical attendance trends. From Monday (3/2) two weeks ago, to last Monday (3/9) the interaction frequency dropped from 0.155 - 0.127. Historically this value typically hovers around 0.166, so once again, some of these COVID effects were visible in February, but last week saw the biggest drop.
Employees Shifted to Using Solo-type Spaces In-Office
What explains the drop in interaction frequencies amongst people who are still physically present? We find that while physical attendance rates have dropped across all types of spaces, the difference is more substantial for spaces that are explicitly for collaboration and interaction. Consider the following two figures, which break down employee flows by the type of spaces being occupied.
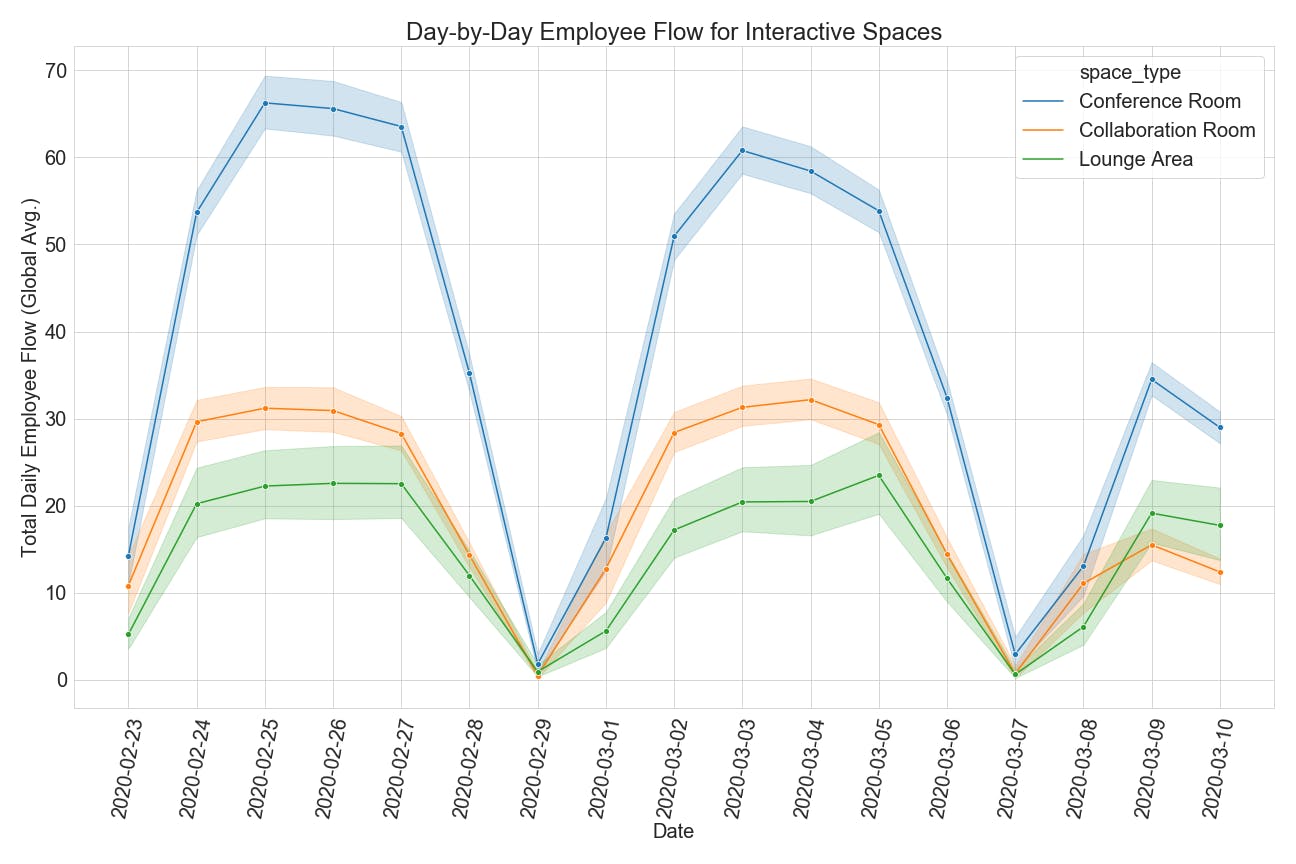
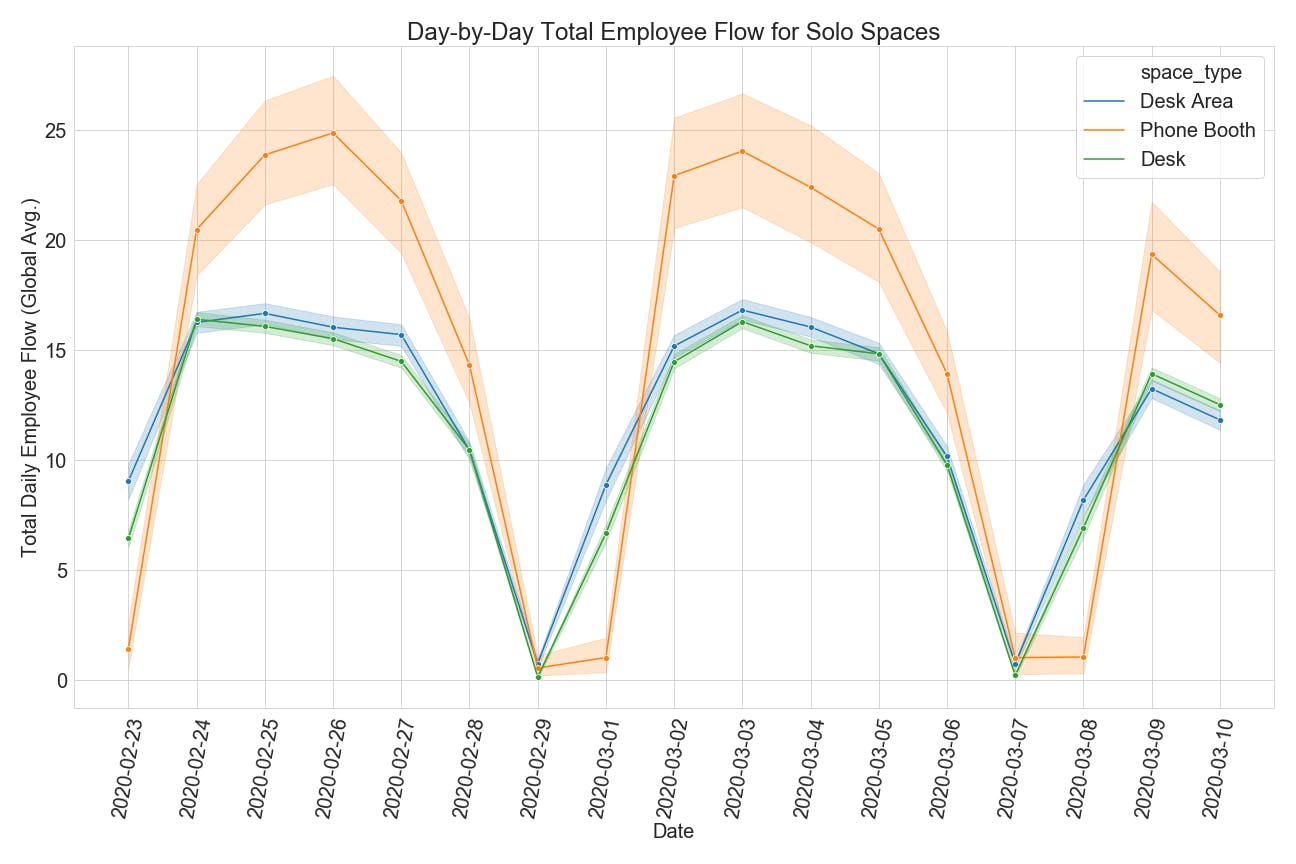
Notice that while there is only a slight drop in total employee flow for solo spaces, such as desks and phone booths, occupancy rates for inherently interactive spaces are substantially down.
The blue line in the top figure, for example, shows that conference room rates have roughly halved in just one week!
Bottom line: employees are practicing social distancing even when in the same office space.
Conclusion
The unprecedented spread and severity of COVID-19 is affecting office utilization and employee behaviors throughout the world. VergeSense’s data show that not only did people go to their offices less last week, but also that social distancing was beginning within workplaces before most workers were ordered to work from home this week.
As events with COVID-19 evolve over the long-term, we expect worker behavior will continue to evolve. With a limited number of ‘essential staff’ still making their way into offices across the country - how will they utilize office space? Furthermore, as we make progress against the outbreak in the months to come, how will companies slowly reintroduce workers to their offices?
Finally, what type of workplace will they come back to and will this crisis create a giant reset button for reimagining the uses of offices in the future?
We’ll be checking in along the way.